
Yesterday, I spent an hour on the phone with the producer of a national news series.
I realized afterward that much of the conversation reminded me of dozens of similar conversations with journalists throughout my 40-year career as an educator because I had to carefully and repeatedly clarify what standardized tests do and mean.
Annually for more than the first half of my career, I had to watch as the US slipped into Education Crisis mode when SAT scores were released.
Throughout the past five decades, I have been strongly anti-testing and anti-grades, but most of my public and scholarly work challenging testing addressed the many problems with the SAT—and notably how the media, public, and politicians misunderstand and misuse SAT data.
See these for example:
- The truth about failure in US schools | Paul Thomas
- Testing capitalism: Perpetuating privilege behind the masks of merit and objectivity, The International Education Journal: Comparative Perspectives, 2013, 12(2), 85–103
- PISA Brainwashing: Measure, Rank, Repeat
- SAT Reboot 2016: “Nonsense It All Is”
Over many years of critically analyzing SAT data as well as the media/public/political responses to the college entrance exam, many key lessons emerged that include the following:
- Lesson: Populations being tested impact data drawn from tests. The SAT originally served the needs of elite students, often those seeking Ivey League educations. However, over the twentieth century, increasingly many students began taking the SAT for a variety of reasons (scholarships and athletics, for example). The shift in population of students being tested from an elite subset (the upper end of the normal curve) to a more statistically “normal” population necessarily drove the average down (a statistical fact that has nothing to do with school or student quality). While statistically valid, dropping SAT scores because of population shifts created media problems (see below); therefore, the College Board recentered the scoring of the SAT.
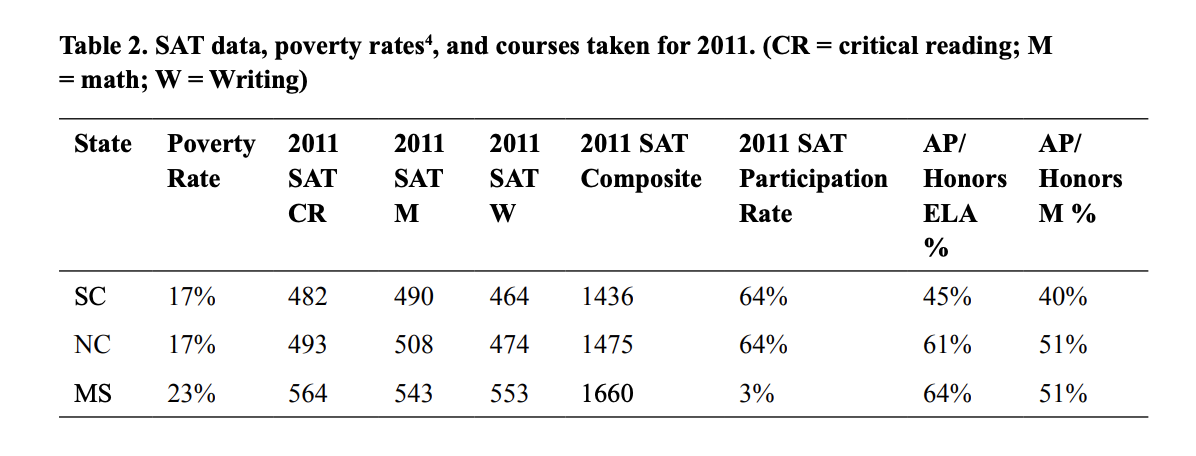
- Lesson: Ranking by test data must account for population differences among students tested. Reporting in the media of average SAT scores for the nation and by states created a misleading narrative about school quality. Part of that messaging was grounded in the SAT reporting average SAT scores by ranking states, and then, media reporting SAT average scores as a valid assessment of state educational quality. The College Board eventually issued a caution: “Educators, the media and others should…not rank or rate teachers, educational institutions, districts or states solely on the basis of aggregate scores derived from tests that are intended primarily as a measure of individual students.” However, the media continued to rank states using SAT average scores. SAT data has always been strongly correlated with parental income, parental level of education, and characteristics of students such as gender and race. But a significant driver of average SAT scores also included rates of participation among states. See for example a comparison I did among SC, NC, and MS (the latter having a higher poverty rate and higher average SAT because of a much lower participation rate, including mostly elite students):
- Lesson: Conclusions drawn from test data must acknowledge purpose of test being used (see Gerald Bracey). The SAT has one very narrow purpose—predicting first-year college grades; and the SAT has primarily one use—a data point for college admission based on its sole purpose. However, historically, media/public/political responses to the SAT have used the data to evaluate state educational quality and the longitudinal progress of US students in general. In short, SAT data has been routinely misused because most people misunderstand its purpose.
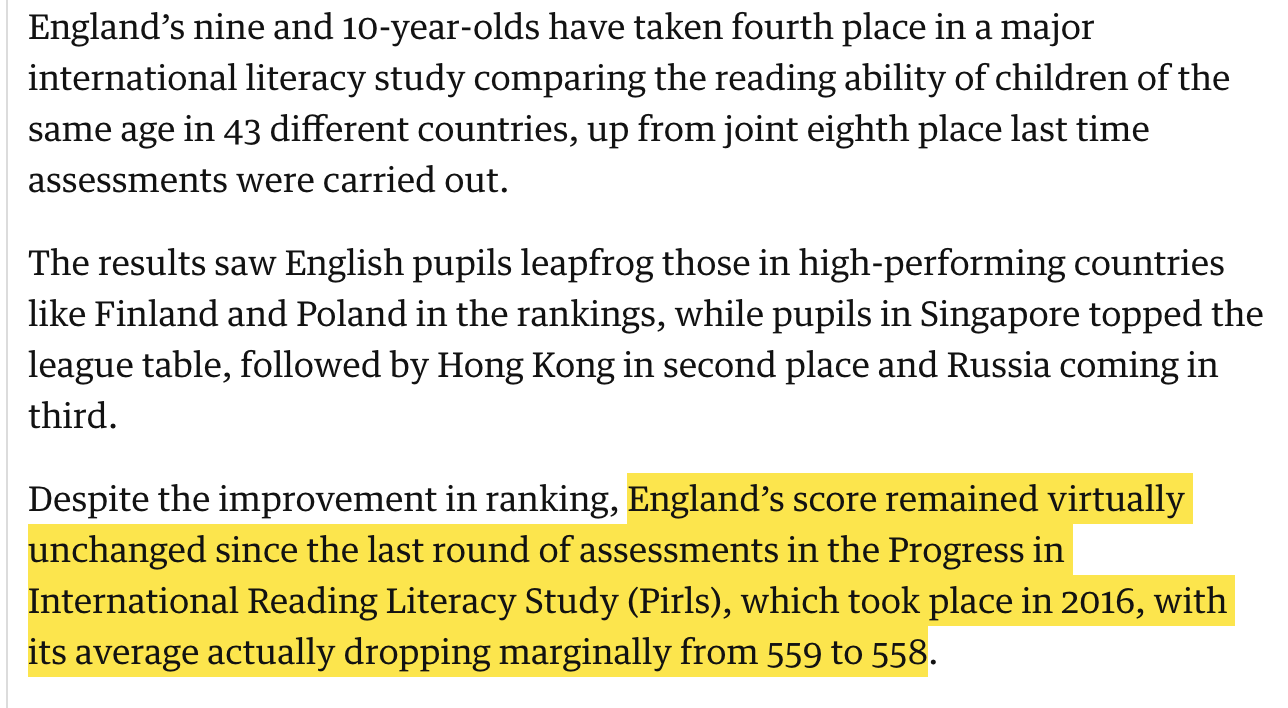
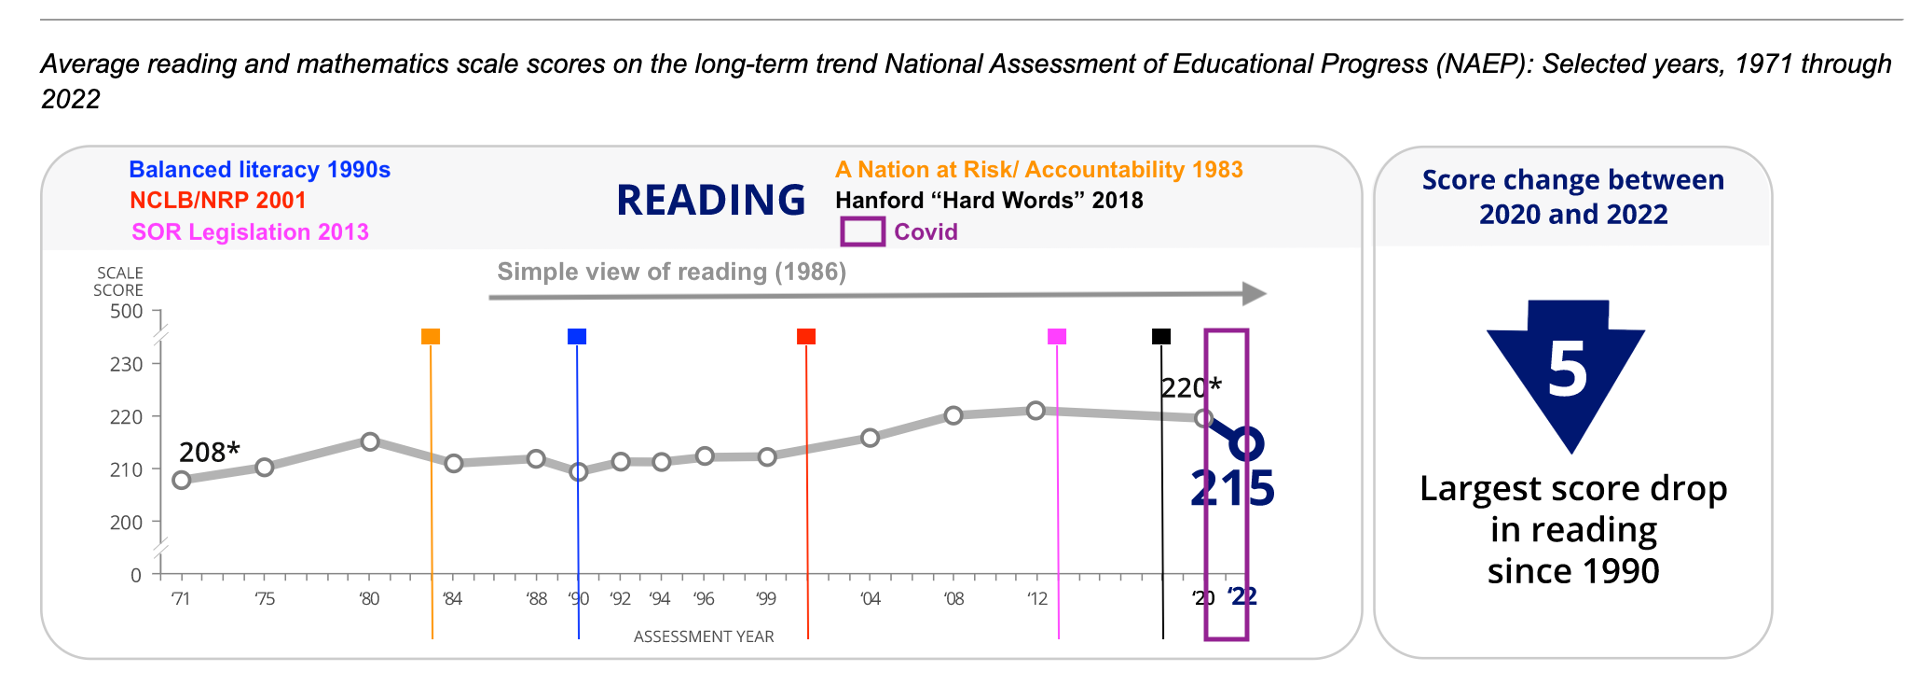
Recently, the significance of the SAT has declined, students taking the ACT at a higher rate and more colleges going test-optional, but the nation has shifted to panicking over NAEP data instead.
The rise in significance of NAEP includes the focus on “proficiency” included in NCLB mandates (which required all states to have 100% student proficiency by 2014).
The problem now is that media/public/political responses to NAEP mimic the exact mistakes during the hyper-focus on the SAT.
NAEP, like the SAT, then, needs a moment of reckoning also.
Instead of helping public and political messaging about education and education reform, NAEP has perpetuated the very worst stories about educational crisis. That is in part because there is no standard for “proficiency” and because NAEP was designed to provide a check against state assessments that could set cut scores and levels of achievement as they wanted:
Since states have different content standards and use different tests and different methods for setting cut scores, obviously the meaning of proficient varies among the states. Under NCLB, states are free to set their own standards for proficiency, which is one reason why AYP school failure rates vary so widely across the states. It’s a lot harder for students to achieve proficiency in a state that has set that standard at a high level than it is in a state that has set it lower. Indeed, even if students in two schools in two different states have exactly the same achievement, one school could find itself on a failed-AYP list simply because it is located in the state whose standard for proficient is higher than the other state’s….
Under NCLB all states must administer NAEP every other year in reading and mathematics in grades 4 and 8, starting in 2003. The idea is to use NAEP as a “check” on states’ assessment results under NCLB or as a benchmark for judging states’ definitions of proficient. If, for example, a state reports a very high percentage of proficient students on its state math test but its performance on math NAEP reveals a low percentage of proficient students, the inference would be that this state has set a relatively easy standard for math proficiency and is trying to “game” NCLB.
What’s Proficient?: The No Child Left Behind Act and the Many Meanings of Proficiency
In other words, NAEP was designed as a federal oversight of state assessments and not an evaluation tool to standardize “proficient” or to support education reform, instruction, or learning.
As a result, NAEP, as the SAT/ACT has done for years, feeds a constant education crisis cycle that also fuels concurrent cycles of education reform and education legislation that has become increasingly authoritarian (mandating specific practices and programs as well as banning practices and programs).
With the lessons from the SAT above, then, NAEP reform should include the following:
- Standardizing “proficient” and shifting from grade-level to age-level metrics.
- Ending state rankings and comparisons based on NAEP average scores.
- Changing testing population of students by age level instead of grade level (addressing impact of grade retention, which is a form of state’s “gaming the system” that NAEP sought to correct). NAEP testing should include children in an annual band of birth months/years regardless of grade level.
- Providing better explanations and guidance for reporting and understanding NAEP scores in the context of longitudinal data.
- Developing a collaborative relationship between federal and state education departments and among state education departments.
While I remain a strong skeptic of the value of standardized testing, and I recognize that we over-test students in the US, I urge NAEP reform and that we have a NAEP reckoning for the sake of students, teachers, and public education.
Recommended
Literacy and NAEP Proficient, Tom Loveless
The NAEP proficiency myth, Tom Loveless