Tag Archives: NAEP

Once Again, NAEP? Nope: “states and schools have lied about the rigor of their courses”

Some say the world will end in fire,
Some say in ice.

“Fire and Ice,” Robert Frost

While it appears I was right about Teacher Appreciation Week 2014, I was a tad bit off about the source of the Zombie Apocalypse or Armageddon: The world will not end because of PISA score rankings, but because of stagnant NAEP scores by high school students.

In fact, the U.S. Department of Education has just released a hot-off-the-press bumper sticker that celebrates Teacher Appreciation Week 2014 by acknowledging recent NAEP data:

USDOE TAW 2014

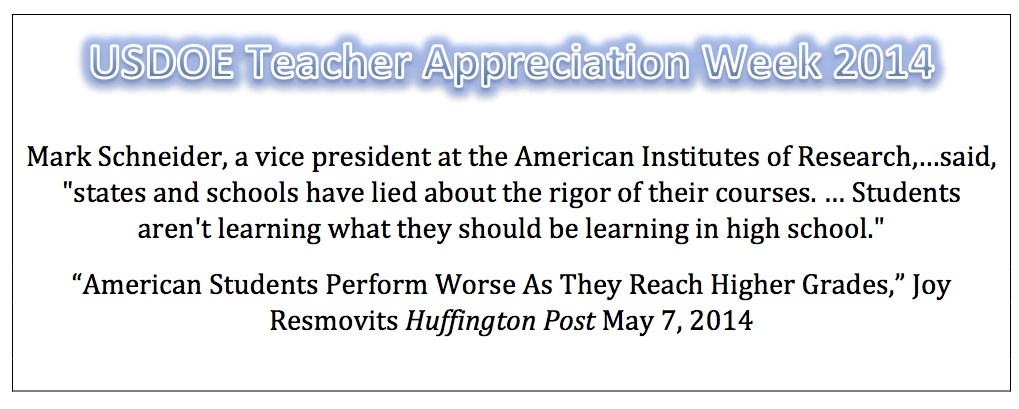
What happens when inept political leadership (Note: The 21st century prerequisite for holding the position of Secretary of Education appears to be a gentle blend of an absence of expertise and outright dishonesty related to NAEP reporting) collides with press-release journalism [1] (like an asteroid slamming into the Earth)?

Well, the claim made above by Schneider (“a vice president at the American Institutes of Research who previously led the government arm that administered NAEP”)—a truly ugly claim about education and teachers that appears to have been accepted without any request for evidence (Evidence? Secretary Duncan, You Can’t Handle the Evidence).

NAEP, then, once again prompts handwringing about stagnant scores and achievement gaps—and there are always charts and graphs to make the point along with the usual insincere nod to “the Civil Rights Issue of Our Time”:

U.S. Secretary of Education Arne Duncan said in a statement about the results, “We project that our nation’s public schools will become majority-minority this fall—making it even more urgent to put renewed attention into the academic rigor and equity of course offerings and into efforts to redesign high schools. We must reject educational stagnation in our high schools, and as [a] nation, we must do better for all students, especially for African-American and Latino students.”

Amongst the ugliness and baseless pontificating by political leaders are absent some key points that the media will fail (again) to uncover:

  • NAEP data are released and pronouncements made, but no one really knows the cause of the data concerns. Why scores appear stagnant and why racial/socioeconomic gaps persist are often complex (although a huge and evidence-based source of both is likely inequity and poverty). The initial reactions to NAEP this time in EdWeek and HuffPo are overwhelmingly speculation by people with political agendas. If we are genuinely interested in people who are likely telling lies, it appears we may want to look at the people cited in these articles.
  • “Achievement gap” is a misnomer for “opportunity gaps,” and using standardized tests to measure and examine that gap is inherently flawed since standardized testing remains biased by race, class, and gender; and thus, the tests themselves not only measure but create the gaps. Furthermore, for any gap to close, identified populations of students would need to be treated differently, but the current policy is a common core of what students experience in schools. And another dirty little secret is that the current era of accountability has damned high-poverty and minority students to test-prep course work that in fact asks less of them (thus, it is not “states and schools” that are telling lies, but politicians who shape accountability policy who are in fact telling lies).
  • Throughout the 20th and into the 21st centuries, we have found no correlation between how U.S. students do on test comparisons (among states or internationally) and claimed goals such as international competitiveness or the robustness of the U.S economy. None. And while we are at it, over the last three decades of accountability, we have found no correlation between the existence or quality of standards and measurable student outcomes. None. Again, it is a political lie to continue to cry “crisis” over test scores. A lie.

While I remain certain that accountability built on standards and high-stakes testing is a fundamental flaw in education reform, political leadership and the media are not doing us any favors either. This latest “high school achievement crisis” based on a rush to misread NAEP data is but more of the same—lamentably so as we certainly could do a better job even within the flawed test-based culture of U.S. education, as Matthew Di Carlo has outlined.

Childhood is steeped in a series of lies—what Kurt Vonnegut has labeled “foma,” although many of these lies are not so harmless: the Easter bunny, Santa Claus, work hard and be nice.

But one truism from our youths must be accepted as fact: Action speaks louder than words.

If we apply that to the USDOE, then we are likely to recognize just who is telling lies and about what:

  1. Lie: U.S. schools, teachers, and students are failing because of low standards and expectations.
  2. Lie: New standards and new tests will save public schools.
  3. Lie: State X is worse than State Y because NAEP (or SAT) scores say so; the U.S. is falling behind Country X because PISA scores say so.
  4. Lie: Poverty is not destiny.
  5. Lie: Arne Duncan (or Bill Gates or Michelle Rhee) knows what he is talking about.
  6. Lie: Education reform is the Civil Rights issue of our time.
  7. Lie: U.S. education is struggling because of “bad” teachers who are too hard to fire.
  8. Lie: Charter school X is a “miracle” school.

Truth: The USDOE is the embodiment of “lies, damned lies, and statistics.”

For Further Reading

I love the smell of NAEPalm in the morning

[1] See also Is It Journalism, or Just a Repackaged Press Release? Here’s a Tool to Help You Find Out.


Advertisement

The New York Times in an Era of Kool-Aid Journalism

With Advertisements for the Common Core, the Editorial Board at The New York Times has offered its special brand of Kool-Aid journalism to the careless claim that 2013 NAEP data somehow prove education reform is a success:

The country is engaged in a fierce debate about two educational reforms that bear directly on the future of its schoolchildren: first, teacher evaluation systems that are taking hold just about everywhere, and, second, the Common Core learning standards that have been adopted by all but a few states and are supposed to move the schools toward a more challenging, writing-intensive curriculum.

Both reforms — or at least the principles behind them — got a welcome boost from reading and math scores released recently by the federal government. …

Two examples are the District of Columbia and Tennessee, among the first to install more ambitious standards and teacher evaluations. Tennessee jumped from 46th in the country in fourth-grade math two years ago to 37th, and from 41st in the nation to 34th in eighth-grade reading. The District of Columbia, though still performing below the national average, has also shown progress. The scores of its students improved significantly in both math and English.

Moreover, according to Education Secretary Arne Duncan, the eight states that managed to get the Common Core standards in place in time for the latest National Assessment of Educational Progress exams this year showed improvement from 2009 scores in either reading or math.

Kool-Aid journalism occurs when journalists relinquish their work as researchers and reporters to political appointees—in this case the Editorial Board of the NYT decides to turn Secretary Duncan’s baseless claims into statements of fact that support an editorial position. The Board concludes:

But the progress seen elsewhere — like Tennessee and the District of Columbia — shows that improvement is possible if the states strengthen their resolve and apply solutions that have been shown to work.

However, if the Editorial Board at the NYT had made even a basic effort at confirming Duncan’s claims, the Board could have discovered that NAEP data are complicated and cannot prove in any way that recent reforms are a success.

As I have detailed, and despite my not having any training as a journalist or as an investigative reporter, the Editorial Board could have benefitted from the following clarifications about NAEP that I found easily—all of which discredit Duncan’s claims and the Board’s position:

When I point out that raw changes in state proficiency rates or NAEP scores are not valid evidence that a policy or set of policies is “working,” I often get the following response: “Oh Matt, we can’t have a randomized trial or peer-reviewed article for everything. We have to make decisions and conclusions based on imperfect information sometimes.”

This statement is obviously true. In this case, however, it’s also a straw man. There’s a huge middle ground between the highest-quality research and the kind of speculation that often drives our education debate. I’m not saying we always need experiments or highly complex analyses to guide policy decisions (though, in general, these are always preferred and sometimes required). The point, rather, is that we shouldn’t draw conclusions based on evidence that doesn’t support those conclusions.

This shows that the places with the greatest gains were D.C., Tennessee, and Indiana, three places that have embraced the corporate reform strategy of testing, closing down schools, and opening charters.  If this was the only data we had access to, it would seem to prove that “the ends justify the means” when it comes to education reform….

There are many other things to analyze, and I’m looking forward to reading how others analyze the data.  For example, it is curious that Louisiana had ‘gains’ that were smaller than the national average despite that state having, certainly, the most aggressive reforms occurring.  For ‘reformers’ who are so obsessed with test scores and test score gains, this is certainly something that shouldn’t be ignored.  Also, Washington and Hawaii were pretty high up on the ‘growth’ numbers even though Washington does not have charter schools and Hawaii has been very slow to adopt Race To The Top reforms so their ‘gains’ can’t be attributed to those.

I’m still pretty confident that in the long run education reform based primarily on putting pressure on teachers and shutting down schools for failing to live up to the PR of charter schools will not be good for kids or for the country, in general.  I hope politicians won’t accept the first ‘gains’ chart without putting it into context with the rest of the data.

  • Latest NAEP Results, by G.F. Brandenburg exposes that DC gains pre-date the reforms championed by Duncan and the NYT:

First of all, the increases in some of the scores in DC (my home town) are a continuation of a trend that has been going on since about 2000. As a result of those increases, DC’s fourth grade math students, while still dead last in the nation, have nearly caught up with MISSISSIPPI, the lowest-scoring state in the US.

You will have to strain your imagination to see any huge differences between the trends pre-Rhee and post-Rhee. (She was installed after testing was over in 2007.)…

So, the Educational DEforms instituted by Rhee, Henderson, and their corporate masters have not produced the promised miracles.

Yesterday gave us the release of the 2013 NAEP results, which of course brings with it a bunch of ridiculous attempts to cast those results as supporting the reform-du-jour. Most specifically yesterday, the big media buzz was around the gains from 2011 to 2013 which were argued to show that Tennessee and Washington DC are huge outliers – modern miracles – and that because these two settings have placed significant emphasis on teacher evaluation policy – that current trends in teacher evaluation policy are working – that tougher evaluations are the answer to improving student outcomes – not money… not class size… none of that other stuff.

I won’t even get into all of the different things that might be picked up in a supposed swing of test scores at the state level over a 2 year period. Whether 2 year swings are substantive and important or not can certainly be debated (not really), but whether policy implementation can yield a shift in state average test scores in a two  year period is perhaps even more suspect….

Is Tennessee’s 2-year growth an anomaly? we’ll have to wait at least another two years to figure that out. Was it caused by teacher evaluation policies? That’s really unlikely, given that those states that are equally and even further above their expectations have approached teacher evaluation in very mixed ways and other states that had taken the reformy lead on teacher policies – Louisiana and Colorado – fall well below expectations.

As it stands, the position taken by the NYT Editorial Board lacks even the barest qualities of credibility, but it does expose the utter failure of Kool-Aid journalism.

UPDATED [Part II]: From Spellings to Duncan [Add King and DeVos]: Incompetence and Deceit

UPDATE II: No need for comment except to prompt you to this:

Shanker Blog: We Can’t Graph Our Way Out of the Research on Education Spending

NOTE: With the appointment of John King to replace Duncan, consider this Tweet from Bruce Baker:

While Secretary of Education (2005-2009), Margaret Spellings announced that a jump of 7 points in NAEP reading scores from 1999-2005 was proof No Child Left Behind was working. The problem, however, was in the details:

During President George W. Bush’s tenure, NCLB was a corner stone of his agenda, and when then-Secretary Spellings announced that test scores were proving NCLB a success, Gerald Bracey and Stephen Krashen exposed one of two possible problems with the data. Spellings either did not understand basic statistics or was misleading for political gain. Krashen detailed the deception or ineptitude by showing that the gain Spellings noted did occur from 1999 to 2005, a change of seven points. But he also revealed that the scores rose as follows: 1999 = 212; 2000 = 213; 2002 = 219; 2003 = 218 ; 2005 = 219. The jump Spellings used to promote NCLB and Reading First occurred from 2000 to 2002, before the implementation of Reading First. Krashen notes even more problems with claiming success for NCLB and Reading First, including:

“Bracey (2006) also notes that it is very unlikely that many Reading First children were included in the NAEP assessments in 2004 (and even 2005). NAEP is given to nine year olds, but RF is directed at grade three and lower. Many RF programs did not begin until late in 2003; in fact, Bracey notes that the application package for RF was not available until April, 2002.”

With the 2013 release of NAEP data, then, shouldn’t we be skeptical of Duncan’s rush to claim victory for education reform under Obama?:

This year, Tennessee and the District of Columbia, which have both launched high-profile efforts to strengthen education by improving teacher evaluations and by other measures, showed across-the-board growth on the test compared to 2011, likely stoking more debate. Only the Defense Department schools also saw gains in both grade levels and subjects.

In Hawaii, which has also seen a concentrated effort to improve teaching quality, scores also increased with the exception of fourth grade reading. In Iowa and Washington state, scores increased except in 8th-grade math.

Specifically pointing to Tennessee, Hawaii and D.C., Education Secretary Arne Duncan said on a conference call with reporters that many of the changes seen in these states were “very, very difficult and courageous” and appear to have had an impact.

Duncan’s claims, in fact, have prompted The Wall Street Journal to announce “School Reform Delivers”:

Education Secretary Arne Duncan hailed this year’s National Assessment of Educational Progress (i.e., the nation’s report card) results on Thursday as “encouraging.” That’s true only if you look at Washington, D.C., Tennessee and states that have led on teacher accountability and other reforms….

However, a handful of states did post significant gains, and the District of Columbia and Tennessee stand out. Until very recently, Washington, D.C. was an example of public school failure. Then in 2009 former schools chancellor Michelle Rhee implemented more rigorous teacher evaluations that place a heavy emphasis on student learning. The district also tied pay to performance evaluations and eliminated tenure so that ineffective teachers could be fired.

Between 2010 and 2012, about 4% of D.C. teachers—and nearly all of those rated “ineffective”—were dismissed. About 30% of teachers rated “minimally effective” left on their own, likely because they didn’t receive a pay bump and were warned that they could be removed within a year if they failed to shape up.

Clearing out the deadwood appears to have lifted scores.

As I warned on the release date of NAEP, we should anticipate this careless and unsupported eagerness to use NAEP data as evidence of corporate reform success.

Jim Horn has highlighted that NAEP shows a powerful picture of the growing problem with re-segregation and the entrenched reality of racial and socioeconomic achievement gaps—messages ignored by Duncan. At the very least, then, Duncan is cherry-picking.

Gary Rubinstein has also dismantled the DC NAEP “miracle,” and G.F. Brandenburg provides a clear chart showing that DC gains are a continuation of a trend pre-Rhee, and thus before the policies praised by Duncan. As Rubinstein concludes:

I’m still pretty confident that in the long run education reform based primarily on putting pressure on teachers and shutting down schools for failing to live up to the PR of charter schools will not be good for kids or for the country, in general.  I hope politicians won’t accept the first ‘gains’ chart without putting it into context with the rest of the data.

With the USDOE at Duncan’s disposal, it seems careless and inexcusable to make unproven claims that policy has caused test score changes when no one has had time to analyze the data in order to make such claims.

As Bruce Baker explains, after showing making causational claims between reform policy and NAEP gains is tenuous at best:

Is Tennessee’s 2-year growth an anomaly? We’ll have to wait at least another two years to figure that out [emphasis added]. Was it caused by teacher evaluation policies? That’s really unlikely, given that those states that are equally and even further above their expectations have approached teacher evaluation in very mixed ways and other states that had taken the reformy lead on teacher policies – Louisiana and Colorado – fall well below expectations.

Like Spellings, Duncan proves that he is either unqualified to be Secretary of Education due to a lack of understanding of statistics or that he is willing to place partisan politics above what is best for children and public education. Either way, this is yet another example of failure from the top in the world of education reform and politics—as well as the likelihood that the mainstream media will continue to play along.

NAEP? Nope: Why (Almost) Everyone Will Misread (Again) Data on Gaps

Let the data orgy begin!

NAEP data have been released and I anticipate almost as much time and money will be wasted on the data as has been wasted on administering the tests, scoring the tests, and creating the handy web link to all that data—notably the predictable link to gaps. [For the record, most of these data charts can be prepared without any child ever taking tests; just use the socioeconomic data on each child and extrapolate.]

Take a moment and scroll through the gray space between myriad groups in both math and reading.

There, enjoy it?

While you’re at it, look at the historical gaps between males and females in the SAT.

Males on average outscore females in reading and math (though females outscore males in writing, the one section of the SAT that doesn’t count for anything anywhere, hmmmm).

The problem, of course, is that standardized test data are simply metrics for social conditions that we pretend are measures of learning and teaching.

It is a particularly nasty game, but it seems few are going to stop playing any time soon. “Achievement gap”* has now ascended to the point of being classified as a subset of Tourette syndrome among politicians and education reformers.

The problems with persisting to lament achievement gaps and then address those gaps with new standards and more testing are that the solutions both primarily measure those gaps and contribute to them:

  • Standardized testing remains biased by class, race, and gender.
  • Standardized test scores remain mostly a reflection of any child’s home (from about 60% to as much as 86%).
  • School and classes students take are more often than not a reflection of the community and homes children are born into; thus, school/learning quality is determined by a child’s socioeconomic status, but those schools do not change that status.
  • If affluent children and impoverished children are provided equal learning opportunities (which they are not), the gap cannot close (go back and look at the handy NAEP charts on gaps, by the way).

The short point is something different has to be done in both the lives and schools of children in poverty (as well as racial and language subgroups overrepresented in poverty) if those data-point gaps are ever going to be reduced.

David Berliner (2013) is illustrative of what those differences should entail, using PISA data often instrumental in ranking educational quality of countries:

Let me look at inequality and schooling internationally: Do countries with greater income inequality generally do worse on achievement tests than countries where income inequality and poverty is lower? The answer is yes (Condron, 2011). Larger income disparities within a nation are associated with lower scores on international tests of achievement. For example, on the 2006 mathematics tests of the Program on International Student Achievement, with a mean score near 500, Finland scored above all other nations (548), and substantially beat the United States of America (474). But Finland is a country with low inequality and a very low childhood poverty rate. But suppose that Finland had the same rate of childhood poverty as the United States of America, and the United States of America had the same rate of childhood poverty as Finland. What might the scores of these two nations be like then? If one statistically adjusted each nation’s scores using the poverty rate of the other, then Finland’s score is predicted to be 487, a long way from the top position it had attained. The score for the United States of America would have been 509, quite a bit better than it actually did. Clearly, inequality within a nation matters. If large numbers of youth in a nation are poor, then achievement test scores are likely to be lower. If there were a reduction in the poverty rate of a nations’ youth, achievement scores are likely to go up….

To those who say that poverty will always exist, it is important to remember that many Northern European countries such as Norway and Finland have virtually wiped out childhood poverty. (pp. 205, 208)

Thus, if we are bound and determined to persist in our fetish for test scores and remain committed to raising test scores (instead of actually alleviating inequity or providing all children with wonderful and rich school days that would end in learning and happiness), guess what?

We need to do something different than what we have been doing for thirty-plus years!

First, end the standards-testing rat race.

Second, end childhood poverty.

Reference

David C. Berliner (2013) Inequality, Poverty, and the Socialization of America’s Youth for the Responsibilities of Citizenship, Theory Into Practice, 52:3, 203-209, DOI: 10.1080/00405841.2013.804314

* Please see my series on “achievement gaps”:

Achievement Gap Misnomer for Equity Gap, pt. 1

Achievement Gap Misnomer for Equity Gap, pt. 2