remnant 39: “Lou Reed was massively important to ‘Island of Misfit Toys’ kids”.
All posts by plthomasedd
The Poverty Trap: Slack, Not Grit, Creates Achievement
Poverty is a trap children are born into:

No child has ever chosen to be poor. Children have never caused the poverty that defines their lives, and their education.
Yet, the adults with political, corporate, and educational wealth and power—who demand “no excuses” from schools and teachers serving the new majority of impoverished children in public schools and “grit” from children living in poverty and attending increasingly segregated schools that offer primarily test-prep—embrace a very odd stance themselves: Their “no excuses” and “grit” mottos stand on an excuse that there is nothing they can do about out-of-school factors such as poverty.
Living in poverty is a bear trap (and it is), and education is a race, a 100-meter dash.
“No excuses” advocates calling for grit, then, are facing this fact:
Children in poverty line up at the starting line with a bear trap on one leg; middle-class children start at the 20-, 30-, and 40-meter marks; and the affluent stand at the 70-, 80-, and 90-meter marks.
And while gazing at education as a stratified sprint, “no excuses” reformers shout to the children in poverty: “Run twice as fast! Ignore the bear trap! And if you have real grit, gnaw off your foot, and run twice as fast with one leg!”
These “no excuses” advocates turn to the public and shrug, “There’s nothing we can do about the trap, sorry.”
What is also revealed in this staggered 100-meter race is that all the children living and learning in relative affluence are afforded slack by the accidents of their birth: “Slack” is the term identified by Mullainathan and Shafir as the space created by abundance that allows any person access to more of her/his cognitive and emotional resources.
In the race to the top that public education has become, affluent children starting at the 90-meter line can jog, walk, lie down, and even quit before the finish line. They have the slack necessary to fail, to quit, and to try again—the sort of slack all children deserve.
Children in relative affluence do not have to wrestle with hunger, worry about where they’ll sleep, feel shame for needing medical treatment when they know their family has no insurance and a tight budget, or watch their families live every moment of their lives in the grip of poverty’s trap.
As Mullainathan and Shafir explain: “Scarcity captures the mind.” And thus, children in poverty do not have such slack, and as a result, their cognitive and emotional resources are drained, preoccupied.
The ugly little secret behind calls for “no excuses” and “grit” is that achievement is the result of slack, not grit.
Children living and learning in abundance are not inherently smarter and they do not work harder than children living and learning in poverty. Again, abundance and slack actually allow children to work slower, to make more mistakes, to quit, and to start again (and again).
Quite possibly, an even uglier secret behind the “no excuses” claim that there is nothing the rich and powerful can do about poverty is that this excuse is also a lie.
David Berliner (2013) carefully details, “To those who say that poverty will always exist, it is important to remember that many Northern European countries such as Norway and Finland have virtually wiped out childhood poverty” (p. 208).
More children are being born into the trap of poverty in the U.S., and as a result, public schools are now serving impoverished students as the typical student.
The “no excuses” and “grit” mantras driving the accountability era have been exposed as ineffective, but have yet to be acknowledged as dehumanizing.
Instead of allowing some children to remain in lives they didn’t choose or create and then condemning them also to schools unlike the schools affluent children enjoy, our first obligation as free people must be to remove the trap of poverty from every leg of every child.
Reference
David C. Berliner (2013) Inequality, Poverty, and the Socialization of America’s Youth for the Responsibilities of Citizenship, Theory Into Practice, 52:3, 203-209, DOI: 10.1080/00405841.2013.804314
UPDATE
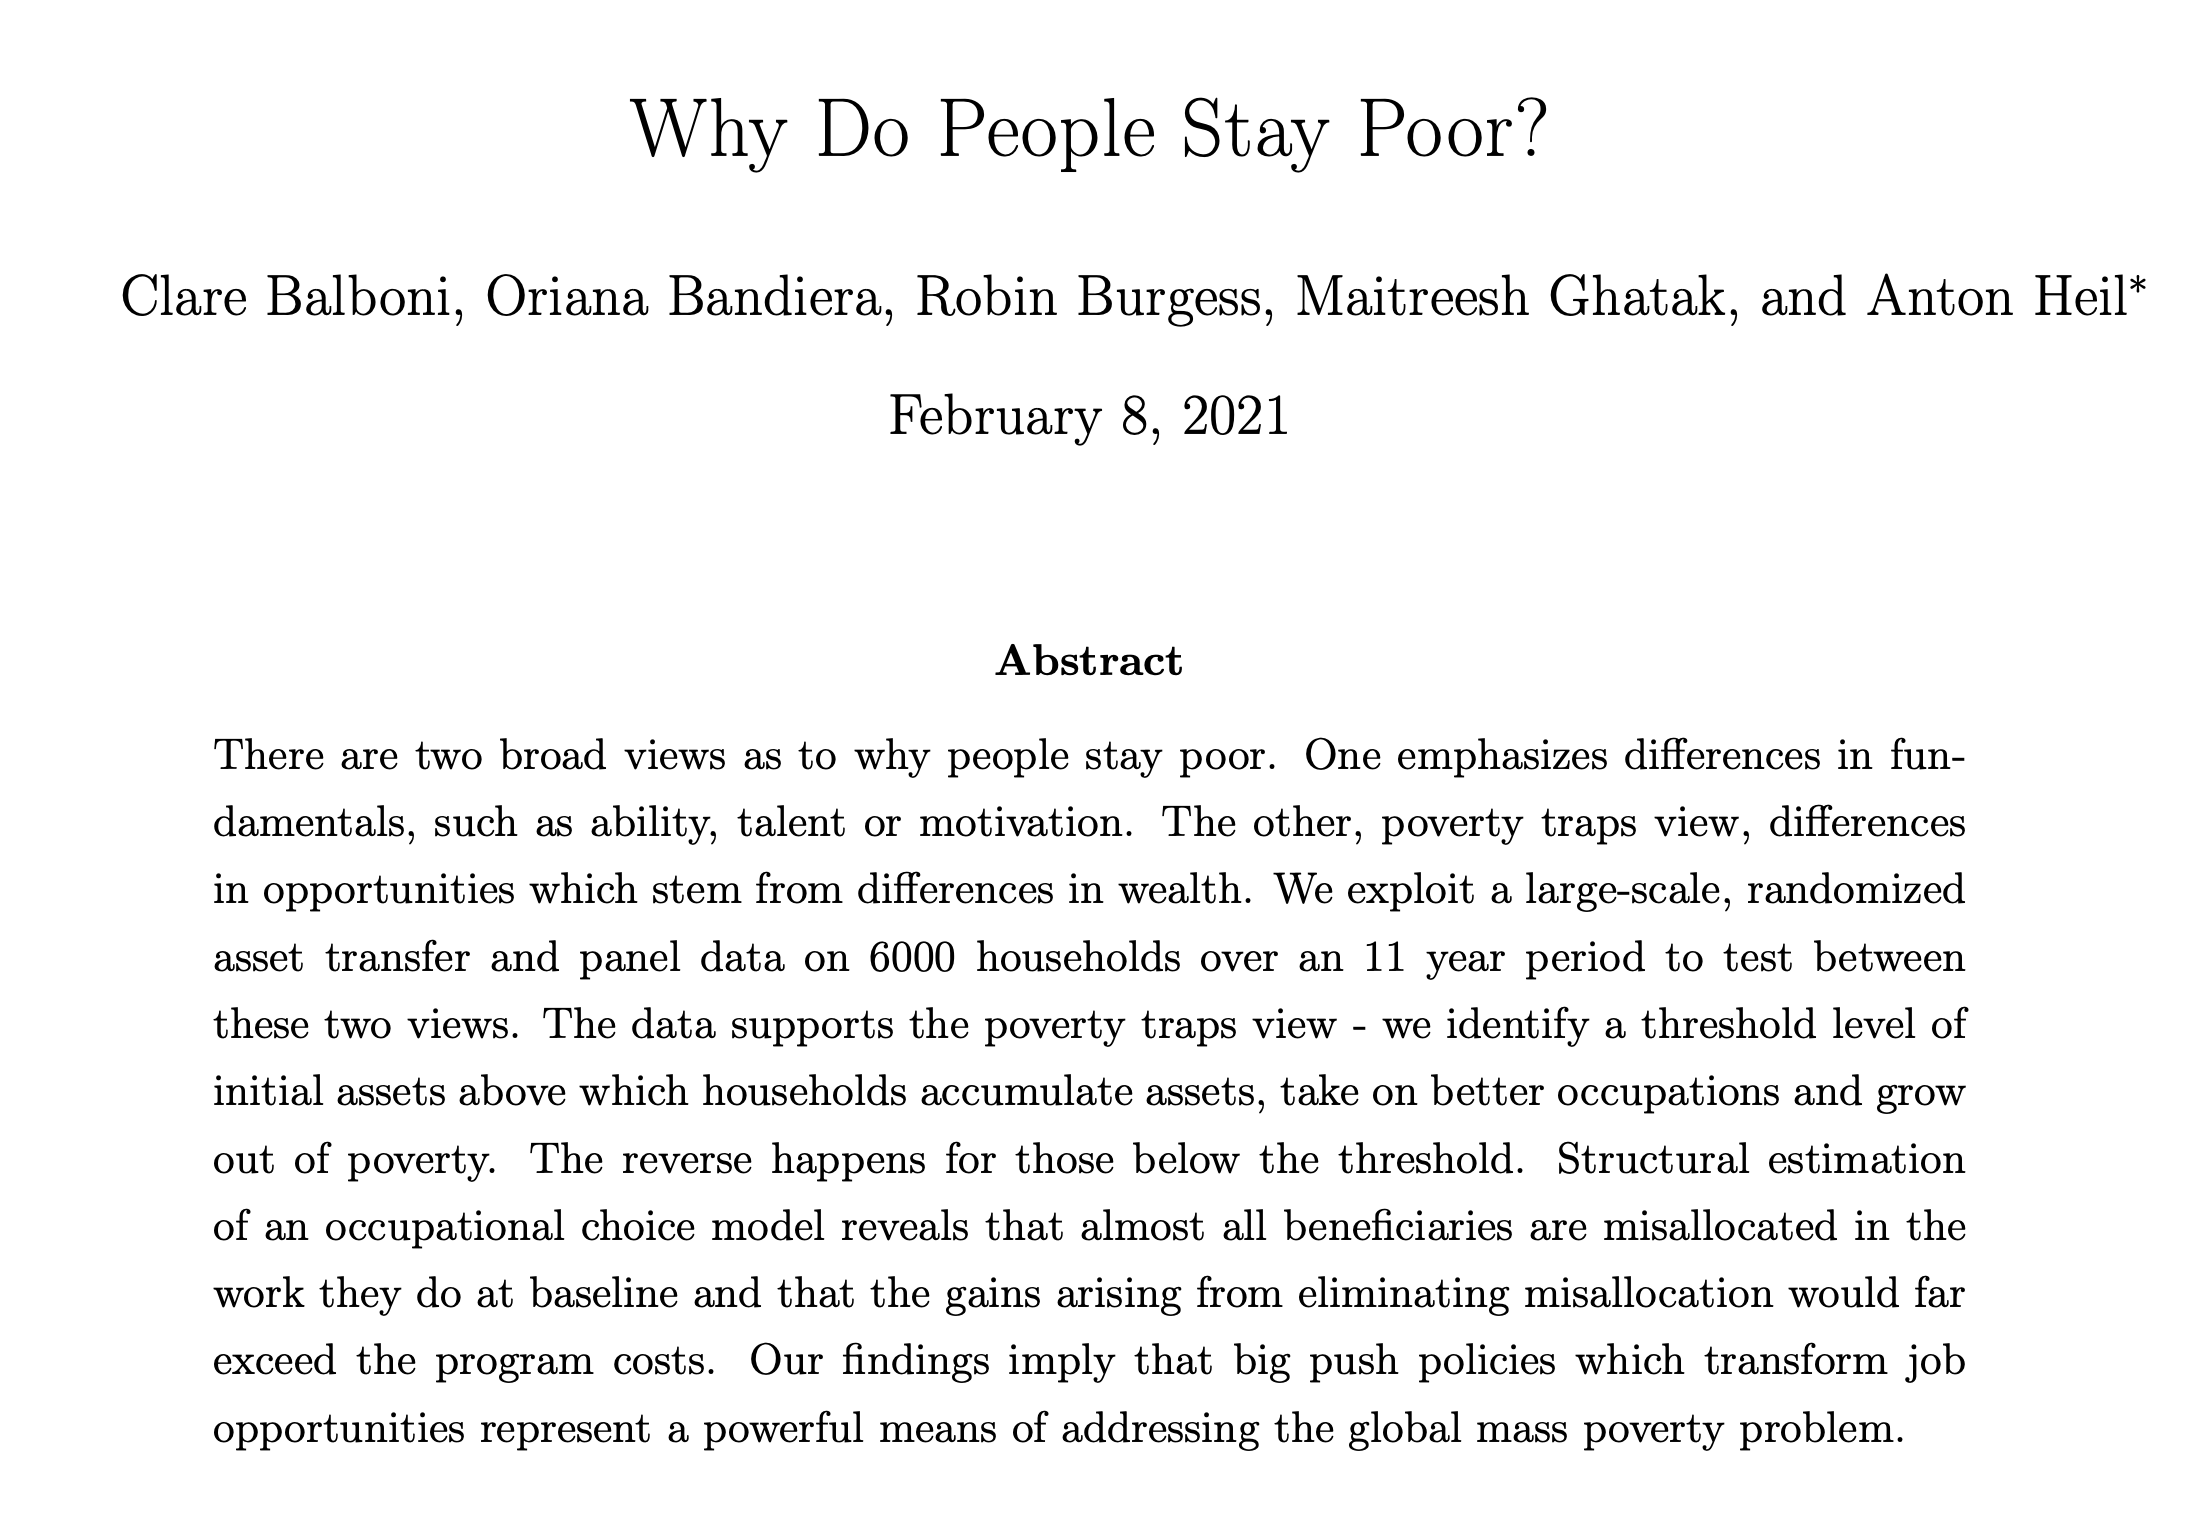
Why Do People Stay Poor? Clare Balboni, Oriana Bandiera, Robin Burgess, Maitreesh Ghatak, and Anton Heil
UPDATED [Part II]: From Spellings to Duncan [Add King and DeVos]: Incompetence and Deceit
UPDATE II: No need for comment except to prompt you to this:
Shanker Blog: We Can’t Graph Our Way Out of the Research on Education Spending
NOTE: With the appointment of John King to replace Duncan, consider this Tweet from Bruce Baker:
If not duped, then entirely deceitful – you choose: https://t.co/AefSz1praF
— Bruce Baker (@SchlFinance101) October 8, 2015
—
While Secretary of Education (2005-2009), Margaret Spellings announced that a jump of 7 points in NAEP reading scores from 1999-2005 was proof No Child Left Behind was working. The problem, however, was in the details:
During President George W. Bush’s tenure, NCLB was a corner stone of his agenda, and when then-Secretary Spellings announced that test scores were proving NCLB a success, Gerald Bracey and Stephen Krashen exposed one of two possible problems with the data. Spellings either did not understand basic statistics or was misleading for political gain. Krashen detailed the deception or ineptitude by showing that the gain Spellings noted did occur from 1999 to 2005, a change of seven points. But he also revealed that the scores rose as follows: 1999 = 212; 2000 = 213; 2002 = 219; 2003 = 218 ; 2005 = 219. The jump Spellings used to promote NCLB and Reading First occurred from 2000 to 2002, before the implementation of Reading First. Krashen notes even more problems with claiming success for NCLB and Reading First, including:
“Bracey (2006) also notes that it is very unlikely that many Reading First children were included in the NAEP assessments in 2004 (and even 2005). NAEP is given to nine year olds, but RF is directed at grade three and lower. Many RF programs did not begin until late in 2003; in fact, Bracey notes that the application package for RF was not available until April, 2002.”
With the 2013 release of NAEP data, then, shouldn’t we be skeptical of Duncan’s rush to claim victory for education reform under Obama?:
This year, Tennessee and the District of Columbia, which have both launched high-profile efforts to strengthen education by improving teacher evaluations and by other measures, showed across-the-board growth on the test compared to 2011, likely stoking more debate. Only the Defense Department schools also saw gains in both grade levels and subjects.
In Hawaii, which has also seen a concentrated effort to improve teaching quality, scores also increased with the exception of fourth grade reading. In Iowa and Washington state, scores increased except in 8th-grade math.
Specifically pointing to Tennessee, Hawaii and D.C., Education Secretary Arne Duncan said on a conference call with reporters that many of the changes seen in these states were “very, very difficult and courageous” and appear to have had an impact.
Duncan’s claims, in fact, have prompted The Wall Street Journal to announce “School Reform Delivers”:
Education Secretary Arne Duncan hailed this year’s National Assessment of Educational Progress (i.e., the nation’s report card) results on Thursday as “encouraging.” That’s true only if you look at Washington, D.C., Tennessee and states that have led on teacher accountability and other reforms….
However, a handful of states did post significant gains, and the District of Columbia and Tennessee stand out. Until very recently, Washington, D.C. was an example of public school failure. Then in 2009 former schools chancellor Michelle Rhee implemented more rigorous teacher evaluations that place a heavy emphasis on student learning. The district also tied pay to performance evaluations and eliminated tenure so that ineffective teachers could be fired.
Between 2010 and 2012, about 4% of D.C. teachers—and nearly all of those rated “ineffective”—were dismissed. About 30% of teachers rated “minimally effective” left on their own, likely because they didn’t receive a pay bump and were warned that they could be removed within a year if they failed to shape up.
Clearing out the deadwood appears to have lifted scores.
As I warned on the release date of NAEP, we should anticipate this careless and unsupported eagerness to use NAEP data as evidence of corporate reform success.
Jim Horn has highlighted that NAEP shows a powerful picture of the growing problem with re-segregation and the entrenched reality of racial and socioeconomic achievement gaps—messages ignored by Duncan. At the very least, then, Duncan is cherry-picking.
Gary Rubinstein has also dismantled the DC NAEP “miracle,” and G.F. Brandenburg provides a clear chart showing that DC gains are a continuation of a trend pre-Rhee, and thus before the policies praised by Duncan. As Rubinstein concludes:
I’m still pretty confident that in the long run education reform based primarily on putting pressure on teachers and shutting down schools for failing to live up to the PR of charter schools will not be good for kids or for the country, in general. I hope politicians won’t accept the first ‘gains’ chart without putting it into context with the rest of the data.
With the USDOE at Duncan’s disposal, it seems careless and inexcusable to make unproven claims that policy has caused test score changes when no one has had time to analyze the data in order to make such claims.
As Bruce Baker explains, after showing making causational claims between reform policy and NAEP gains is tenuous at best:
Is Tennessee’s 2-year growth an anomaly? We’ll have to wait at least another two years to figure that out [emphasis added]. Was it caused by teacher evaluation policies? That’s really unlikely, given that those states that are equally and even further above their expectations have approached teacher evaluation in very mixed ways and other states that had taken the reformy lead on teacher policies – Louisiana and Colorado – fall well below expectations.
Like Spellings, Duncan proves that he is either unqualified to be Secretary of Education due to a lack of understanding of statistics or that he is willing to place partisan politics above what is best for children and public education. Either way, this is yet another example of failure from the top in the world of education reform and politics—as well as the likelihood that the mainstream media will continue to play along.
Learning and Teaching in Scarcity: How High-Stakes ‘Accountability’ Cultivates Failure | Alternet
remnant 38: “I still owe money to the money to the money I owe”
NAEP? Nope: Why (Almost) Everyone Will Misread (Again) Data on Gaps
Let the data orgy begin!
NAEP data have been released and I anticipate almost as much time and money will be wasted on the data as has been wasted on administering the tests, scoring the tests, and creating the handy web link to all that data—notably the predictable link to gaps. [For the record, most of these data charts can be prepared without any child ever taking tests; just use the socioeconomic data on each child and extrapolate.]
Take a moment and scroll through the gray space between myriad groups in both math and reading.
…
There, enjoy it?
While you’re at it, look at the historical gaps between males and females in the SAT.
Males on average outscore females in reading and math (though females outscore males in writing, the one section of the SAT that doesn’t count for anything anywhere, hmmmm).
The problem, of course, is that standardized test data are simply metrics for social conditions that we pretend are measures of learning and teaching.
It is a particularly nasty game, but it seems few are going to stop playing any time soon. “Achievement gap”* has now ascended to the point of being classified as a subset of Tourette syndrome among politicians and education reformers.
The problems with persisting to lament achievement gaps and then address those gaps with new standards and more testing are that the solutions both primarily measure those gaps and contribute to them:
- Standardized testing remains biased by class, race, and gender.
- Standardized test scores remain mostly a reflection of any child’s home (from about 60% to as much as 86%).
- School and classes students take are more often than not a reflection of the community and homes children are born into; thus, school/learning quality is determined by a child’s socioeconomic status, but those schools do not change that status.
- If affluent children and impoverished children are provided equal learning opportunities (which they are not), the gap cannot close (go back and look at the handy NAEP charts on gaps, by the way).
The short point is something different has to be done in both the lives and schools of children in poverty (as well as racial and language subgroups overrepresented in poverty) if those data-point gaps are ever going to be reduced.
David Berliner (2013) is illustrative of what those differences should entail, using PISA data often instrumental in ranking educational quality of countries:
Let me look at inequality and schooling internationally: Do countries with greater income inequality generally do worse on achievement tests than countries where income inequality and poverty is lower? The answer is yes (Condron, 2011). Larger income disparities within a nation are associated with lower scores on international tests of achievement. For example, on the 2006 mathematics tests of the Program on International Student Achievement, with a mean score near 500, Finland scored above all other nations (548), and substantially beat the United States of America (474). But Finland is a country with low inequality and a very low childhood poverty rate. But suppose that Finland had the same rate of childhood poverty as the United States of America, and the United States of America had the same rate of childhood poverty as Finland. What might the scores of these two nations be like then? If one statistically adjusted each nation’s scores using the poverty rate of the other, then Finland’s score is predicted to be 487, a long way from the top position it had attained. The score for the United States of America would have been 509, quite a bit better than it actually did. Clearly, inequality within a nation matters. If large numbers of youth in a nation are poor, then achievement test scores are likely to be lower. If there were a reduction in the poverty rate of a nations’ youth, achievement scores are likely to go up….
To those who say that poverty will always exist, it is important to remember that many Northern European countries such as Norway and Finland have virtually wiped out childhood poverty. (pp. 205, 208)
Thus, if we are bound and determined to persist in our fetish for test scores and remain committed to raising test scores (instead of actually alleviating inequity or providing all children with wonderful and rich school days that would end in learning and happiness), guess what?
We need to do something different than what we have been doing for thirty-plus years!
First, end the standards-testing rat race.
Second, end childhood poverty.
Reference
David C. Berliner (2013) Inequality, Poverty, and the Socialization of America’s Youth for the Responsibilities of Citizenship, Theory Into Practice, 52:3, 203-209, DOI: 10.1080/00405841.2013.804314
* Please see my series on “achievement gaps”:
CAUTION: Technology!
In the myriad debates surrounding implementation of Common Core and the concurrent tests, the sheer costs of this process tends to be ignored. Another issue related to both CC and the related costs is yet another series of commitments to technology as a part of the perpetual education reform process. Here is a reposting of a presentation [see Note below] I gave offering a stern caution about our repeated rush to embrace technology:
Author Kurt Vonnegut quipped, “Novels that leave out technology misrepresent life as badly as Victorians misrepresented life by leaving out sex.” As with novels, so with schools, I believe, but we must take one step beyond “whether schools should address technology” to “how.”
In Walden, Henry David Thoreau offered two warnings that should guide how we approach technology: “We are in great haste to construct a magnetic telegraph from Maine to Texas; but Maine and Texas, it may be, have nothing important to communicate,” and, “We do not ride on the railroad; it rides upon us.”
It’s a Book, Lane Smith [VIDEO]
Shifting from seeking technology for technology’s sake to critical technological awareness
- Caution: Inflated costs (market forces) in state-of-the-art technology
- Caution: Pursuing state-of-the-art technology is self-defeating since “state-of-the-art” is a moving target; teaching students to use state-of-the-art technology fails to recognize that it will be “old” technology once students leave school. Also, state-of-the-art technology has a high risk/reward factor since many “new” gadgets fail and many “new” upgrades fizzle. Consider the storage facilities at schools filled with cables, software, out-dated hardware, and the LaserDisk players that never caught on.
- Caution: New technology has inflated costs AND embedded costs related to repair and upgrades.
- Caution: Adding new technology or upgrading existing technology requires added time spent for teachers (in-service) and students to learn the technology itself, draining time better served on teaching and learning themselves.
- Caution: Research base, although sparse, does not support a positive role for technology in improving teaching/learning, and evidence we have shows teachers rarely use technology provided (EdWeek synthesis of research on technology):
That study found that most of the schools that have integrated laptops and other digital tools into learning are not maximizing the use of those devices in ways that best make use of their potential.
From “Who really benefits from putting high-tech gadgets in classrooms?” (Los Angeles Times, February 4, 2012):
Almost every generation has been subjected in its formative years to some “groundbreaking” pedagogical technology. In the ’60s and ’70s, “instructional TV was going to revolutionize everything,” recalls Thomas C. Reeves, an instructional technology expert at the University of Georgia. “But the notion that a good teacher would be just as effective on videotape is not the case.”
Many would-be educational innovators treat technology as an end-all and be-all, making no effort to figure out how to integrate it into the classroom. “Computers, in and of themselves, do very little to aid learning,” Gavriel Salomon of the University of Haifa and David Perkins of Harvard observed in 1996. Placing them in the classroom “does not automatically inspire teachers to rethink their teaching or students to adopt new modes of learning.”
…In 2009, the Education Department released a study of whether math and reading software helped student achievement in first, fourth, and sixth grades, based on testing in hundreds of classrooms. The study found that the difference in test scores between the software-using classes and the control group was “not statistically different from zero.“In sixth-grade math, students who used software got lower test scores — and the effect got significantly worse in the second year of use.
- Caution: Seeking to close GAPS (equity, achievement, technology) found in the lives of children (children in poverty, disadvantaged; children in affluence, privileged) through education presents a paradox: As Walt Gardner has succinctly explained: “Don’t forget that advantaged children are not standing still in the interim. They continue to benefit from travel and other enriching learning experiences. As a result, the gap will persist.”
- Caution: Begin with educational (teaching/learning) NEEDS, not the allure of new technology.
References
Thomas, P. L. (2012, January 3). A misguided use of money. Room for Debate. The New York Times.
—–. (2011, December 2). No. At Issue in CQ Researcher, p. 1017.
http://library.cqpress.com/cqresearcher/ and http://wrestlingwithwriting.blogspot.com/2011/12/cq-researcher-online.html
NOTE: This originally was a presentation, as below:
March 8-9, 2012
9:30-10:15
CAUTION!: Technology
P. L. Thomas, EdD
Associate Professor of Education
Furman University
UPDATE:
Larry Cuban, Answering the Big Question on New Technology in Schools: Does It Work? (Part 1)
See related: Technology In Education: An Answer In Search Of A Problem?
Schools Matter: Union Leadership as Political Sleight of Hand
Are Common Core and Testing Debates “Two Different Matters”?
A comment posted on my blog about union support for Common Core (CC)—which parallels my blog post about Secretary Duncan and the Obama administration’s support for CC—represents a typical response coming from standards advocates in the CC debate: “You can’t combine the issue of high stakes testing with the common core [sic] they are two different matters.”
Alfie Kohn in January 2010 argued against national standards in Education Week; I then offered a direct rejection of CC in the same publication in August of 2010. A few others took early stances against CC, such as Susan Ohanian (whose work is impressive and certainly well before most people raised any concerns) and Stephen Krashen.
Diane Ravitch and Carol Burris have taken stances opposing CC more recently, and they represent thoughtful and patient considerations of the exact issue raised by the comment quoted above. At first, Ravitch and Burris appeared willing to consider that CC could prove to be an effective reform mechanism. But both of their explanations for deciding to oppose CC are windows into my initial and continuing stance against the expensive and unnecessary venture into what for most states will be the third or fourth set of standards and high-stakes tests in about thirty years.
I have been a teacher for those thirty years, in fact—the first 18 years spent as a public school teacher in the rural South and the last 13 years as a teacher educator in the same region.
My work as a classroom teacher in the 1980s and 1990s was characterized by quarterly multiple-choice benchmark tests of reading and quarterly writing samples from my students that asked them to write one of four types of writing: description, narration, persuasion, or exposition (types that do not exist as stand-alone forms in the real world, by the way, but exist only in a world where standards and testing rule).
During those years also, state standards changed three times, and concurrent with those changes, we adopted new textbooks and sat through hours and hours of in-service, handed over more and more class time to test-prep, and implemented SAT courses during the school day (ones for which students received credit toward graduation) that required huge investments in hardware and software, which mostly never worked (my home state of SC has a history of so-called low SAT scores so our 1990s approach to addressing that was to encourage more students to take the SAT).
Eventually, the entire state of SC became invested in MAP testing while students at the high school where I taught were assigned two ELA and two math courses as sophomores if they had 8th-grade test data suggesting they would struggle with the state high-stakes tests. Our administration assigned as many as half our sophomores in double ELA and math courses, in fact.
One legacy of this test-mania was that many sophomores in our school wrote only 3-5-3 essays (3-sentence introduction, 5-sentence body paragraph, 3-sentence conclusion) because that was how they were trained to answer on the state writing test—a strategy that did increase how many passed but also ignored good writing pedagogy and mis-educated those students severely.
In the 1980s and 1990s, my high school became a master of doing the wrong thing the right way as we were regularly the top-scoring school in the state on the state’s high-stakes tests.
Once at higher education, I watched my teacher candidates and teachers in the surrounding public schools suffer under yet more revisions to the standards and two different versions of high-stakes tests (since the mid-1980s, SC has implemented BSAP and then PACT and then PASS); now the entire state is implementing CC and poised for the CC-based and once again new set of high-stakes test.
All of this is to say: If you have ever taught in public schools during the past three decades you know that the comment quoted at the beginning is patently false. In fact, if you have taught in public schools during the past three decades you know that CC cannot be separated from highs-stakes testing.
In 2013, with almost all states in the U.S. committed to CC, with the U.S. Department of Education supporting CC, with teachers’ unions supporting CC, with textbook and testing companies supporting CC, and with professional teacher organizations supporting CC, there is a deafening silence about a few facts that must be confronted if anyone or any organization wishes to make this claim: “You can’t combine the issue of high stakes testing with the common core [sic] they are two different matters”:
- Name a state in the U.S. that implemented state standards since 1980 without also implementing high-stakes tests.
- Name a state in the U.S. that has adopted CC and has not adopted some form of high-stakes testing related to CC.
- Name a state that does not have high-stakes accountability mechanisms in place—as a legacy of state legislation and/or as a result of complying with federal mandates within policy such as Race to the Top or opting out of NCLB.
- Name a school (especially a high-poverty school) where “what is tested is what is taught” does not drive most of what occurs in that school.
- Name a state that is not spending tax payer money (totaling in the 10s if not 100s of millions of dollars nationally) on CC resources and technology, CC-aligned text books, CC testing, and CC teacher in-service.
- Name a strong CC advocate who isn’t making money and/or gaining political advantage by endorsing CC.
My doctorate is in curriculum and instruction. A foundational part of my doctoral study and dissertation research, then, explored the century-old debate about what content matters, what should be taught in public schools. Any standards movement is a direct descendent of the larger curriculum debate.
While John Dewey and even Joseph Schwab provide engaging and powerful places upon which Eliot Eisner and others have the luxury of thinking deeply about esoteric things (issues that I too find fascinating), in the real world of day-to-day K-12 teaching, it is pure delusion and myopic idealism to make claims that CC and high-stakes testing debates are “two different matters.”
Around 2000 when my daughter was 11 and attending a public middle school, she came out to the car one day leaning against the weight of her giant backpack, slid into my car, and then said: “All they care about is the PACT test [SC’s high-stakes test at the time]; they don’t care if we learn anything.” [1] She never once as a student mentioned the standards. And in many ways as a child of the accountability era, I think she learned to hate school. She loved her friends and loved many of her teachers, but she hated what school had become throughout the 1990s—which pales to what school has become in the twenty-first century.
Thus, address the bullet points above if you don’t believe me, or better yet, ask a classroom teacher—not a union leader, not a politician, not a representative of Pearson, not a consultant.
[1] See “Standards, Standards Everywhere, and Not a Spot to Think,” English Journal (2001, September).
Rising Weight of Poverty on Public Schools
[This ran without hyperlinks at The Greenville News (November 1, 2013) and The Charleston Post & Courier (November 4, 2013)]
According to 1860 census data, South Carolina had the highest percentage (57.2%) of its population as slaves in the U.S. Beaufort County (82.8%) and Georgetown County (85.7%) represented the significant impact of slave populations along the coast.
The legacy of the scar of slavery in SC remains in the form of I-95 and what is now recognized as the “Corridor of Shame”—a collection of public schools bordering that interstate highway and serving in some of the highest poverty areas of SC.
Another legacy of the South is school segregation. A 2012 report from The Civil Rights project detailed the rise of re-segregated schools across the South:
Black and Latino students in the South attend schools defined by double isolation by both race and poverty. The South reports high overall shares of students living in poverty, but students of different racial backgrounds are not exposed equally to existing poverty. The typical black and Latino student in the region goes to a school with far higher concentrations of low-income students than the typical white or Asian student.
The South, the report explained, has become a majority-minority region of the U.S.; however, “Since 1991, black students in the South have become increasingly concentrated in intensely segregated minority schools (90-100% minority students).”
In SC, for example, only 38.5% of white students attend majority-minority, high-poverty schools—a slight decrease when compared to 1970 (41.2%), 1980 (42.7%), and 1991 (41.8%). For African American students, however, majority-minority, high-poverty schools are the norm.
An October 2013 study from the Southern Education Foundation has revealed that the “new majority” of students in U.S. public schools are high-poverty. For SC, that means that 54.7% of public school students are living in poverty. This ranking places SC in the bottom quartile of the U.S.—approximately where many of the indicators used to compare the state’s education system rank the state.
The overwhelming evidence now shows that SC is experiencing the same social dynamics that characterize the U.S.—an increase in child and family poverty, a widen gap between the affluent and the working poor and poor, and a slow recognition that public schools tend to reflect and perpetuate those inequities instead of helping children overcome them.
For SC, these messages about re-segregating schools, increasing populations of impoverished students, and rising numbers of English Language learners should signal an end to current public discourse and policy related to education reform.
Many of the policies currently endorsed and poised to be implemented in SC are either not designed to address the poverty problem or are certain to increase the problems students bring to our schools.
For example, charter schools in SC and across the U.S. are not producing student achievement distinguishable from public schools, but charter schools are strongly associated with segregating students by race and class.
As well, redesigning teacher evaluation and pay based on student test scores is guaranteed to discourage SC’s best and brightest teachers from teaching in our high-poverty schools, increasing the historical failure to provide our high-poverty and ELL students with certified and experienced teachers. This same failure is repeated by increasing our commitments to Teach for America, which places uncertified and inexperienced teachers with high-poverty students.
One of most damaging policies being endorsed in SC is the call to retain third graders based on test scores. Retention research for the past forty years shows that retention does not improve achievement but does increase dropping out of school. A test-based retention policy, then, will disproportionately and negatively impact high-poverty and ELL students in our state.
A final, but indirect failure of current education reform is the adoption of Common Core and the related high-stakes tests.
SC’s education problems have nothing to do with our curriculum or our testing. Investing tax payers’ dollars and educators’ time to yet again changing our standards and tests is a tremendous failure of leadership in a state now facing that new majority of high-poverty students.
Saying poverty doesn’t matter appears to be a popular and even effective political ploy, but such baseless claims do nothing to end the weight of poverty on our students, our schools, and our state.
The first step to ending a problem is facing that problem: SC has a poverty problem, and to overcome that, we must make tough political decisions about social and educational policy that current education reform plans fail to address.
